Set the Tone Before You Begin
Engaging with the College and University Political Repressivity Index (CUPRI) requires endurance—not just of the mind, but of the soul. The weight of this work demands focus, movement, and rhythm. To ground yourself in the flow of inquiry and resistance, listen to a curated mix from yours truly—let the beats carry you as you dive into the depths of repression, power, and possibility [mix description].
Understanding Political Repression in Higher Education
Political repression in higher education is neither new nor accidental. Universities have historically functioned as battlegrounds for free expression, political resistance, and institutional control. Today, these institutions remain central to struggles over speech, activism, and power. The College and University Political Repressivity Index (CUPRI) serves as a critical resource for students, families, and advocates navigating an era in which state actors, university administrations, and corporate interests actively suppress student organizing, faculty speech, and racial and economic justice movements.
The CUPRI ranks 180 notable U.S. colleges and universities based on policies, historical actions, and alignment with state and federal political repression initiatives. This report also contextualizes the broader landscape of repression, offering historical analysis, data-based insights, and an overview of the legal, economic, and racial dynamics shaping the suppression of student and faculty activism.
This year’s analysis foregrounds anti-Blackness and Islamophobia in political repression, tracking how institutions have targeted Black student movements, pro-Palestinian activism, and faculty engaged in racial justice work. Universities have long defunded Black student organizations, surveilled Muslim student groups, and disciplined faculty for speaking out against systemic oppression. The CUPRI also ties economic inequality to political repression, following the legacy of the Occupy Wall Street movement, in which universities played a key role in policing economic justice activism.
Additionally, we examine the extent to which universities comply with federal and state directives restricting discussions of race, history, and systemic inequality—including institutions that aligned with the Trump administration’s executive orders banning racial equity programming and more recent legislative efforts to silence racial and economic justice organizing.
The Rising Tide of Political Repression and Racialized Suppression in Higher Education
The creation of the College and University Political Repressivity Index (CUPRI) is more than an academic exercise—it is a necessary response to the deepening crisis of political repression and racialized suppression in American higher education. Institutions with the highest CUPRI scores are not just repressive in policy; they reflect a broader, escalating crisis of Islamophobia, anti-Blackness, transphobia, and hate crimes targeting Asian American, Latinx American, and Indigenous communities.
For most impacted groups, information is not just power—it is protection. Just as The Green Book was created to help Black travelers navigate a segregated and often hostile America, CUPRI exists because students and families deserve a guide to understanding where they will be supported, where they will face opposition, and where institutions are complicit in state repression. Traditional rankings focus on prestige, wealth, or student persistence rates—but none of that matters if a student is criminalized, surveilled, or unsafe. CUPRI fills this gap by centering the experiences of those most impacted by campus repression.
Right now, Islamophobia, anti-Blackness, and other forms of systemic oppression are reaching all-time highs. In 2024, anti-Muslim and anti-Arab hate crimes surged by 7.4%, marking the highest number recorded in decades (Reuters, 2025). At the same time, Black student organizations are being defunded, DEI initiatives are being dismantled, and Indigenous students continue to fight for recognition in institutions that have long excluded them (The Guardian, 2025). Hate crimes based on race, gender, and identity continue to rise, with the FBI reporting over 11,862 incidents in 2023 alone (Justice Department, 2024).
This suppression is happening while President Donald Trump’s administration is constructing detention facilities with plans to incarcerate up to 30,000 people at Guantanamo Bay, expanding state surveillance and repression in ways that inevitably trickle down to universities (The Times, 2025). The arrest of Mahmoud Khalil, a Columbia University graduate student and lawful permanent resident, is a clear example—his participation in pro-Palestinian protests resulted in federal targeting, exposing the direct pipeline between campus activism and state repression (New York Post, 2025).
Malcolm X warned us of this moment decades ago, stating, “We suffer political oppression, economic exploitation, and social degradation—all of them from the same enemy.” (Malcolm X, 1964). These forces are not separate—they reinforce each other. Students and families are already responding, making strategic choices about where they apply, enroll, and invest their futures. Where students go to school is not just an educational decision; it is a political one.
CUPRI is a tool for resistance and accountability. It identifies complicit institutions and tracks where political repression is shaping the student experience. By exposing these realities, we create pathways for transformation and affirm that education should be a place of liberation—not suppression.
LRFB Equity Consulting supports creating free, public resources that empower students and families to make informed decisions. CUPRI sets a new standard: a transparent, data-driven framework that reflects the needs, challenges, and aspirations of those most impacted by systemic inequity.
Welcome to the Green Book for Colleges & Universities. Let’s begin.
Historical Timeline: Political Repression on College Campuses
The timeline below tracks the escalation of political repression on college campuses over six decades, highlighting key moments where universities, in collaboration with state and federal authorities, enacted crackdowns on student activism, faculty speech, and racial and economic justice movements.
1960s–1970s: State Violence Against Civil Rights & Anti-War Protesters
- 1964: The University of California, Berkeley launches mass arrests in response to the Free Speech Movement, criminalizing student activism.
- 1968: The Orangeburg Massacre occurs when police open fire on South Carolina State University students protesting segregation, killing three.
- 1970: National Guard troops kill four students at Kent State University protesting the Vietnam War.
1990s–2010s: The Rise of Campus Policing & DEI Backlash
- 1992: Los Angeles universities increase surveillance and policing of Black student groups following the Rodney King uprisings.
- 2015: The University of Missouri sees mass resignations after Black student protests, prompting a national backlash against diversity, equity, and inclusion (DEI) initiatives.
2020s–Present: Repression Intensifies Under State & Federal Directives
- 2020: George Floyd protests trigger student activism across the country; universities respond with arrests, surveillance, and administrative crackdowns.
- 2021: States begin banning critical race theory and DEI initiatives at public universities, restricting faculty speech on systemic racism.
- 2024: Universities face external pressure to discipline students and faculty advocating for racial justice and global solidarity movements.
- 2025: Political repression reaches new heights as institutions align with state-imposed restrictions on activism and racial discourse.
Methodology: How the College and University Political Repressivity Index is Constructed
The College and University Political Repressivity Index (CUPRI) ranks 180 notable colleges and universities based on a weighted scoring system that evaluates institutions across ten key indicators. The methodology incorporates a mix of qualitative and quantitative data sourced from public records, university policies, faculty testimonies, and investigative journalism.
Data Collection & Analysis
- Public Records: Arrest reports, disciplinary actions, surveillance data.
- University Policies: Speech restrictions, event bans, defunding of student organizations.
- Faculty Tenure Disputes: Academic freedom violations, dismissal of racial justice scholars.
- Student Organizing Histories: Protest suppression, defunding of activist organizations.
- State & Federal Legislation: Anti-protest laws, bans on racial equity programming.
Each university receives a CUPRI score based on these factors, with higher scores indicating greater political repression.
CUPRI Indicators of Political Repressivity
| Indicator | Description | Data Source | Years of Data |
| FIRE Rankings (40%) | Assessment of free speech environments at colleges and universities. | Foundation for Individual Rights and Expression (FIRE) | 2025 |
| Incidents of Political Repression (University-Level) (10%) | Counts incidents where faculty or students faced penalties due to their political expressions. | University records, news reports | 2020-2025 |
| Incidents of Political Repression (Municipality-Level) (10%) | Documents repression incidents in the surrounding city where the university is located. | Local government records, news reports | 2020-2025 |
| Compliance with Executive Orders (10%) | Measures how institutions comply with executive orders related to free speech on campus. | University policy documents, federal records | 2020-2025 |
| Anti-Blackness Related to Political Repression (10%) | Records incidents where repression is linked to anti-Black sentiments. | University incident reports, news articles | 2020-2025 |
| Islamophobia Related to Political Repression (10%) | Documents cases where political repression is linked with Islamophobic sentiments. | University incident reports, news articles | 2020-2025 |
| Income Inequality on Campus (10%) | Assesses economic disparity among students and the extent of economic segregation. | University financial aid records, census data | 2020-2025 |
Quartile Breakdown for Political Repressivity Levels
| CUPRI Score Range | Category | Description |
| 76 – 100 | Most Repressive (1st Quartile) | Schools with systemic suppression of speech, penalties for political expression, and institutionalized bias against political perspectives. |
| 51 – 75 | Highly Repressive (2nd Quartile) | Schools where political repression is still prevalent, but students and faculty may have some avenues for protected speech. |
| 26 – 50 | Moderately Repressive (3rd Quartile) | Schools with balanced policies that allow for political discourse but may have occasional incidents of suppression. |
| 0 – 25 | Least Repressive (4th Quartile) | Institutions that demonstrate a strong commitment to free speech, academic freedom, and minimal political suppression. |
CUPRI Rankings: Identifying the Most and Least Repressive College and University Environments
The College and University Political Repression Index (CUPRI) evaluates institutions across all selectivity levels and regions, ensuring a comprehensive analysis of political repression in higher education. The research considers the complex interplay between local, state, and federal policies and their impact on institutional governance and student experiences. While Black and Latinx college enrollment rates have increased, they remain less likely to attend highly selective four-year universities (Georgetown, 2013).
By accounting for regional differences and institutional selectivity, CUPRI highlights how repression operates across elite institutions, public universities, and community colleges alike, reinforcing the importance of academic freedom and equitable learning environments for all students—not just those in the most selective spaces.
Based on this analysis, the following lists present a sample of the Most Politically Repressive and Least Politically Repressive Universities, ranked by CUPRI scores.
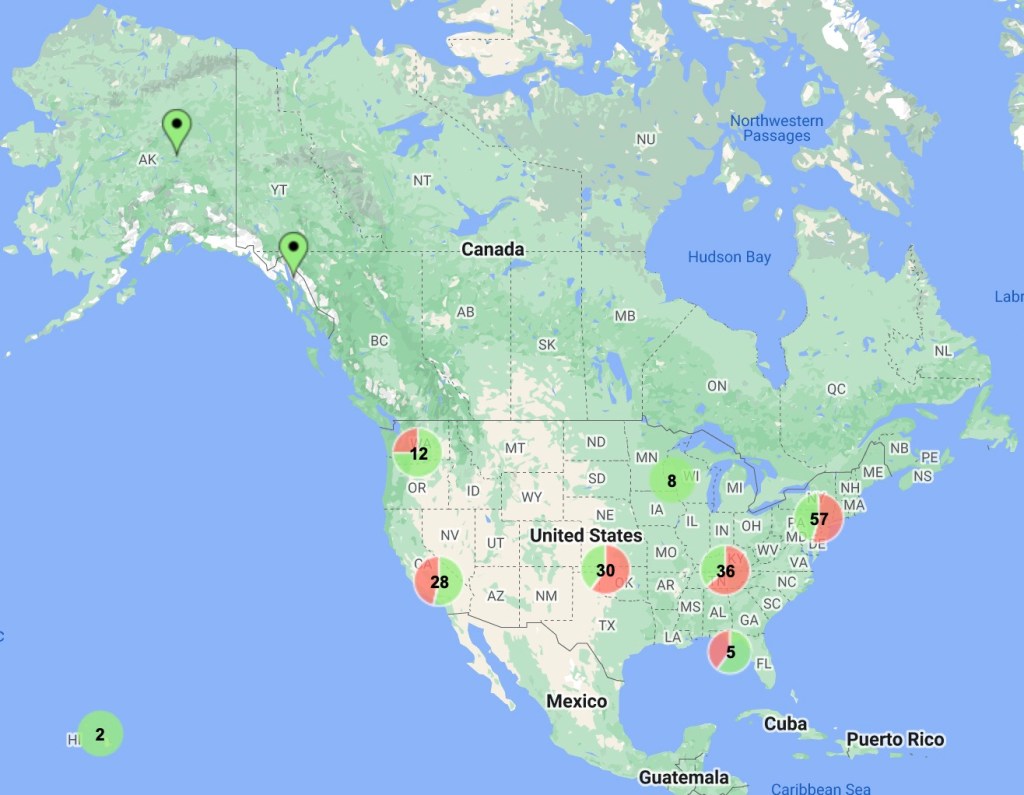
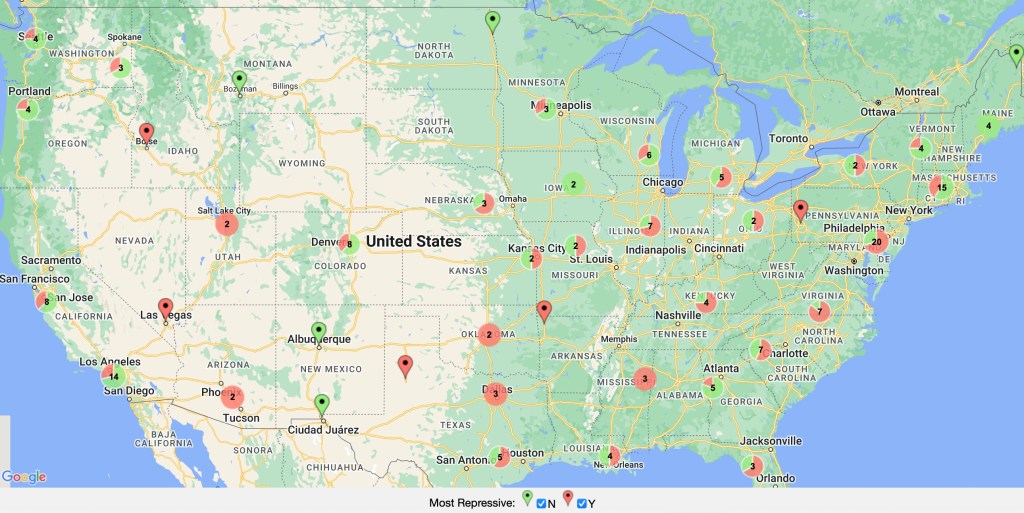
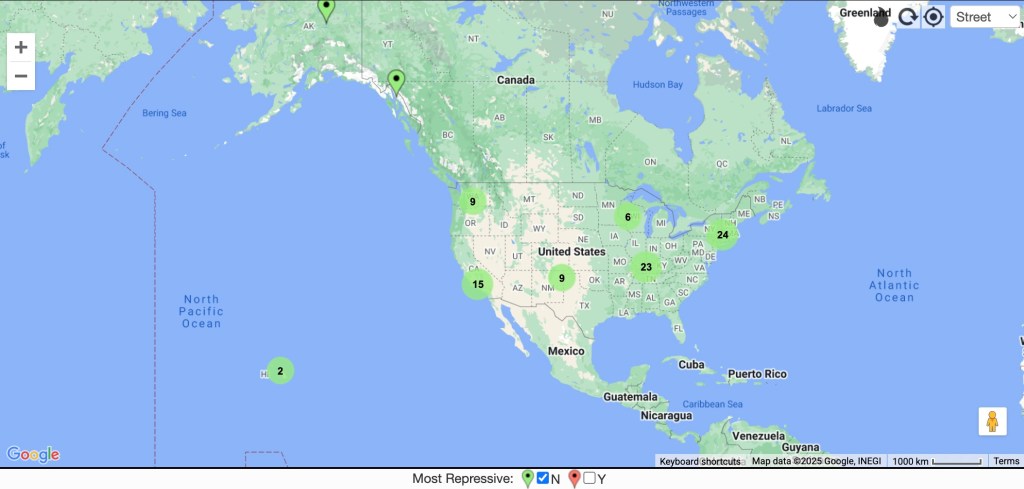
View the 2025 CUPRI Scores – Map View
This interactive map displays universities ranked by their CUPRI score, allowing you to explore how institutions vary in political repressivity. You can highlight the most and least selective universities and observe how they cluster geographically, providing insights into regional trends and institutional environments. Access the map here: https://shorturl.at/QOVrI.
Below you see the CUPRI National Summary for 2025 with green representing the least repressive colleges and universities from the sample and red representing most repressive.
Here’s the Top Politically Repressive Universities with their 2025 CUPRI Scores

- Harvard University – 99.0
- University of Tennessee – 98.5
- Columbia University – 98.5
- University of Chicago – 97.3
- University of South Carolina – 96.0
- University of Nebraska – 95.0
- University of Pennsylvania – 94.3
- American University – 93.6
- University of Oklahoma – 92.0
- Mississippi State University – 91.2
- New York University – 90.5
- Stanford University – 89.9
- University of Wyoming – 88.4
- Liberty University – 88.2
- University of Kentucky – 88.0
- University of Arkansas – 88.0
- University of Maryland – 87.8
- Texas A&M University – 86.4
- Oklahoma State University – 85.7
- University of Florida – 85.6
- Boston College – 85.4
- University of California, Berkeley – 84.9
- George Washington University – 83.7
- University of Southern California – 83.2
- University of South Dakota – 83.0
- University of Alabama – 81.2
- University of Louisiana – 81.0
- Duke University – 79.4
- Georgetown University – 79.1
- University of North Carolina Charlotte – 79.1
- University of Mississippi – 78.8
- Boise State University – 78.7
- University of Texas at Austin – 77.8
- University of Kansas – 76.4
- Vanderbilt University – 76.0
- University of Arizona – 75.5
- University of Missouri – 75.5
- Brigham Young University – 75.1
- Clemson University – 74.7
- Auburn University – 74.7
- University of Idaho – 74.2
- University of Michigan – 73.7
- Yale University – 72.9
- Hillsdale College – 72.0
- University of Georgia – 71.7
- University of Illinois Urbana-Champaign – 71.4
- Princeton University – 71.0
- Texas Tech University – 70.6
- University of Texas at Dallas – 69.9
- Rutgers University – 69.6
- Purdue University – 69.3
- Temple University – 68.9
- University of Connecticut – 68.7
- University of Colorado Boulder – 68.5
- University of Virginia – 68.3
- University of Massachusetts Amherst – 67.9
- Michigan State University – 67.7
- Indiana University Bloomington – 67.4
- Ohio State University – 67.2
- University of Minnesota – 67.0
- Pennsylvania State University – 66.7
- North Carolina State University – 66.5
- University of Delaware – 66.3
- University of Wisconsin-Madison – 66.0
- University of California, Los Angeles – 65.8
- University of Nevada, Las Vegas – 65.6
- University of Oregon – 65.4
- University of Washington – 65.2
- Arizona State University – 65.0
- University of Miami – 64.8
- Syracuse University – 64.6
- Northeastern University – 64.4
- University of Denver – 64.2
- University of Houston – 64.0
- University of Utah – 63.8
- University of Pittsburgh – 63.6
- University of San Diego – 63.4
- Marquette University – 63.2
- Pepperdine University – 63.0
- University of Vermont – 62.8
- Villanova University – 62.6
- Tulane University – 62.4
- Wake Forest University – 62.2
- Fordham University – 62.0
- Southern Methodist University – 61.8
- University of Richmond – 61.6
- University of Central Florida – 61.4
- University of California, Santa Cruz – 61.2
- University of North Texas – 61.0
- Illinois State University – 61.0
Here’s the Least Politically Repressive Universities with their 2025 CUPRI Scores
- Pitzer College – 1.5
- University of California, Riverside – 1.8
- Western Washington University – 2.1
- Swarthmore College – 2.4
- California State University Long Beach – 2.5
- Lewis & Clark College – 2.6
- University of Hawaii Hilo – 2.8
- University of Nebraska Kearney – 2.8
- University of Massachusetts Lowell – 3.1
- Whitman College – 3.3
- University of Alaska Fairbanks – 3.8
- SUNY Geneseo – 3.9
- Knox College – 3.9
- University of Alaska Southeast – 4.3
- University of Louisville – 4.4
- Reed College – 4.7
- Smith College – 4.7
- Howard University – 5.0
- University of Puget Sound – 5.1
- Skidmore College – 5.4
- Occidental College – 5.4
- Bennington College – 5.7
- San Jose State University – 5.8
- University of California, Merced – 5.8
- Colby College – 6.1
- Spelman College – 6.2
- Morehouse College – 6.8
- University of Colorado Denver – 7.2
- University of Maryland Baltimore County – 7.5
- Florida A&M University – 7.5
- Middlebury College – 7.7
- University of Massachusetts Dartmouth – 8.0
- University of New Mexico – 8.0
- University of California, Santa Barbara – 8.3
- Colorado College – 8.3
- North Carolina A&T State University – 8.3
- Truman State University – 8.8
- University of Texas San Antonio – 8.8
- University of Colorado Colorado Springs – 8.9
- University of Illinois Chicago – 9.0
- University of Missouri-Kansas City – 9.6
- University of New Hampshire – 9.6
- California State University Monterey Bay – 9.8
- Portland State University – 9.9
- Clark Atlanta University – 10.2
- California State University Fullerton – 10.2
- San Diego State University – 10.5
- University of Wisconsin Milwaukee – 11.4
- Tuskegee University – 11.5
- Goucher College – 11.6
- Sonoma State University – 11.9
- University of Michigan Dearborn – 12.3
- Xavier University of Louisiana – 12.8
- University of Minnesota Morris – 13.3
- University of California, San Diego – 13.5
- University of Washington Bothell – 13.6
- University of North Dakota – 14.0
- Dillard University – 14.0
- St. Mary’s College of Maryland – 14.1
- University of Maine Presque Isle – 14.5
- University of North Carolina Asheville – 15.2
- Grinnell College – 15.3
- Wesleyan University – 15.4
- Brown University – 15.4
- Macalester College – 15.6
- University of Maine – 15.7
- Montana State University – 16.0
- California Polytechnic State University – 16.3
- University of Hawai’i at Mānoa – 16.9
- Oberlin College – 17.4
- University of Wisconsin Green Bay – 18.0
- Western Carolina University – 18.1
- Eastern Washington University – 18.5
- University of Wisconsin Stevens Point – 18.5
- Bard College – 18.6
- University of Texas El Paso – 19.3
- University of Northern Iowa – 19.5
- Colorado State University Pueblo – 19.5
- Bowdoin College – 19.6
- University of Houston-Downtown – 19.7
- University of California, Irvine – 20.3
- University of Northern Colorado – 20.4
- Appalachian State University – 20.6
- University of Maine Farmington – 20.9
- Sarah Lawrence College – 21.0
- Vassar College – 21.8
- Grand Valley State University – 22.3
- Haverford College – 22.5
- California State University Northridge – 22.8
- University of Illinois Springfield – 22.9
Conclusion: Defending Academic Freedom & Student Organizing
As state repression intensifies, universities face a stark choice:
- Align with political crackdowns on racial and economic justice movements.
- Or protect academic freedom and student rights.
The College and University Political Repressivity Index (CUPRI) provides a data-driven framework for understanding these choices and equipping students, faculty, and families with the knowledge to make informed decisions.
References
1. American Civil Liberties Union (ACLU). (2024). Surveillance on College Campuses: The Erosion of Student Privacy. Retrieved from http://www.aclu.org
2. Equal Justice Initiative (EJI). (2024). Historical and Contemporary Racial Suppression on College Campuses. Retrieved from http://www.eji.org
3. Foundation for Individual Rights and Expression (FIRE). (2025). 2025 College Free Speech Rankings. Retrieved from http://www.thefire.org
4. Georgetown University Center on Education and the Workforce. (2013). Separate & Unequal: How Higher Education Reinforces the Intergenerational Reproduction of White Racial Privilege. Retrieved from cew.georgetown.edu
5. Human Rights Watch. (2025). University Crackdowns on Political Dissent: A Global Perspective on U.S. Higher Education. Retrieved from http://www.hrw.org
6. Malcolm X. (1964). Speech at the Founding Rally of the Organization of Afro-American Unity. New York, NY.
7. National Center for Education Statistics (NCES). (2020-2025). IPEDS Data: Enrollment, Diversity, and Student Outcomes. Retrieved from nces.ed.gov/ipeds
8. New York Post. (2025). Columbia Graduate Student Arrested for Protest Involvement: A Sign of Growing Campus Crackdowns? Retrieved from http://www.nypost.com
9. Reuters. (2025). Anti-Muslim and Anti-Arab Hate Crimes Surge to Highest Levels in Decades. Retrieved from http://www.reuters.com
10. Southern Poverty Law Center (SPLC). (2025). Hate and Extremism on College Campuses: Annual Report. Retrieved from http://www.splcenter.org
11. The Chronicle of Higher Education. (2025). Academic Freedom Under Threat: The State of Faculty Speech and Tenure Protections. Retrieved from http://www.chronicle.com
12. The Guardian. (2025). Defunding Black Student Organizations: The Silent Attack on Campus Activism. Retrieved from http://www.theguardian.com
13. U.S. Department of Education. (2020-2025). College Scorecard Data: Institutional Characteristics and Demographics. Retrieved from collegescorecard.ed.gov
14. U.S. Department of Justice. (2024). Hate Crime Statistics Report 2023. Retrieved from http://www.justice.gov/hatecrimes
Legal Disclaimer
The Corporate University Political Repressivity Index (CUPRI) is a research-based tool developed by LRFB Equity Consulting, LLC. It evaluates higher education institutions using a set of structured indicators grounded in public records, qualitative analysis, and frameworks such as the Political Repression Index and Community Co-Design for Equity.
The findings, rankings, and classifications presented in this report reflect the professional assessment and opinion of the authors based on publicly accessible data and documented institutional practices. While the methodology is rigorous and transparent, this publication is not a statement of fact about the internal intent, legality, or motivations of any institution.
This report is intended to promote public understanding, transparency, and accountability in the context of political repression, equity rollback, and student and faculty expression. Institutions are welcome to provide additional context or clarifications that may be reflected in future editions.

Leave a comment