By Liam R. F. Bird

Consumer equity is the extent to which our consumption helps mitigate versus exacerbate systems of racism and oppression. It is a structural metric, not a feel-good slogan, and must be tracked, codified, and communicated to drive real equity impact. In our 2025 Consumer Equity Index (CEI), we mapped the Fortune 100 on this dimension. We found a dire picture: only 2 companies earned an “A” (structurally embedding equity), while 90% of the companies scored C, D or F. In practical terms, “70% of our everyday dollar flows through companies graded C, D, or F.” In other words, when we spend, we overwhelmingly fund firms that maintain extractive and oppressive practices.
This first CEI report was aimed at individual consumers and investors. In Part Two, we focus on institutions – school districts, cities, and other public bodies – and trace how taxpayer dollars flow through the same corporate channels. Large districts and municipalities spend many billions each year, much of it on major suppliers. Our question: What share of those budgets is contracted out to Fortune 100 firms, and how many of those firms are low-scoring on the CEI? This analysis uses available budget data from the largest U.S. school systems (e.g. NYC, LA, Chicago, Houston, Miami-Dade) and cities (NYC, LA, Chicago, Houston, Phoenix) to model these exposures. The results show that a substantial portion of public spending is tied to big corporate actors rated “poor” on equity, with profound implications for equity-based budgeting and accountability.
Fortune 100 and the 2025 Consumer Equity Index
The CEI evaluates the top-100 U.S. corporations for structural equity across labor, environmental, racial, political, and governance domains. (It is explicitly not a cosmetic ESG score or DEI report card, but a lens on how corporate power shapes equity in practice). The grade distribution is stark: 2 A’s, 8 B’s, and 71 C/D/F’s out of 100. In short, 90% of the largest firms are not equity-aligned. As our report warned, “nearly all public contracts, retirement accounts, digital platforms, and everyday services move through companies that perpetuate systemic harm.” Indeed, in a racial-capitalist economy, “our dollars are votes.” Every school contract or city purchase effectively signals support for the practices of the vendor. If these vendors are on the low end of the CEI (grades C, D, F), then public funds are indirectly underwriting inequity.
The CEI findings underscore how urgent this is: for example, every time a district buys tech gear or utilities from a Fortune 100 firm (e.g. Apple, Amazon, Comcast), it’s very likely funding a C- or F-rated company. The Index notes that behemoths like Amazon (#2) “suppress labor organizing… and profit from dangerous warehouse conditions,” earning an F. Walmart (#1), also F, is built on union‑busting and low wages. Oil giants ExxonMobil (#3) and Chevron (#10) are F-graded for deep environmental and racial injustices. Tyson Foods (in CPG) is F for child labor and warehouse abuses. Even companies scoring “average” (C) have critical liabilities – e.g. JPMorgan Chase and Bank of America (both C) have histories of predatory lending and fees harming Black and low-income communities. In short, public dollars routed through these firms may as well be funding climate and labor injustice.
School Districts: Sample Budget Exposure to Fortune 100
We consider five of the largest U.S. school districts as examples:
- NYC Department of Education – Budget $41.2B (FY2025)
- Los Angeles Unified (LAUSD) – Budget $18.4B (FY2024)
- Chicago Public Schools (CPS) – Budget $9.4B (FY2024)
- Houston ISD (HISD) – Budget ~$2.1B (FY2025–26)
- Miami-Dade County Public Schools – Budget $7.4B (FY2024–25)
In each district, major categories of spending – utilities and maintenance, transportation, technology, school supplies, food services, and contracted services – often involve large vendors. Many of those vendors are Fortune 100 firms. For modeling, we estimate the Fortune-100 share of each budget. (This is necessarily an approximation, based on known vendor categories and industry share.) For example, the NYC DOE’s $41B includes building utilities (e.g. electricity from Con Edison), student technology (devices from Apple/Google/Microsoft and cloud services from AWS/Google), transportation (large bus or rail contracts), food (systems like Sysco), and many services (uniforms, custodial contracts, etc.). It is plausible that ~30% of a large district’s spending flows to Fortune 100 companies. (Even Walmart or Amazon may supply classroom goods; banks like JP Morgan provide financial services; telecom/IT providers like Verizon/AT&T/Comcast run networks). We then assume roughly 90% of those Fortune-100 dollars go to C–F firms, in line with the CEI distribution.
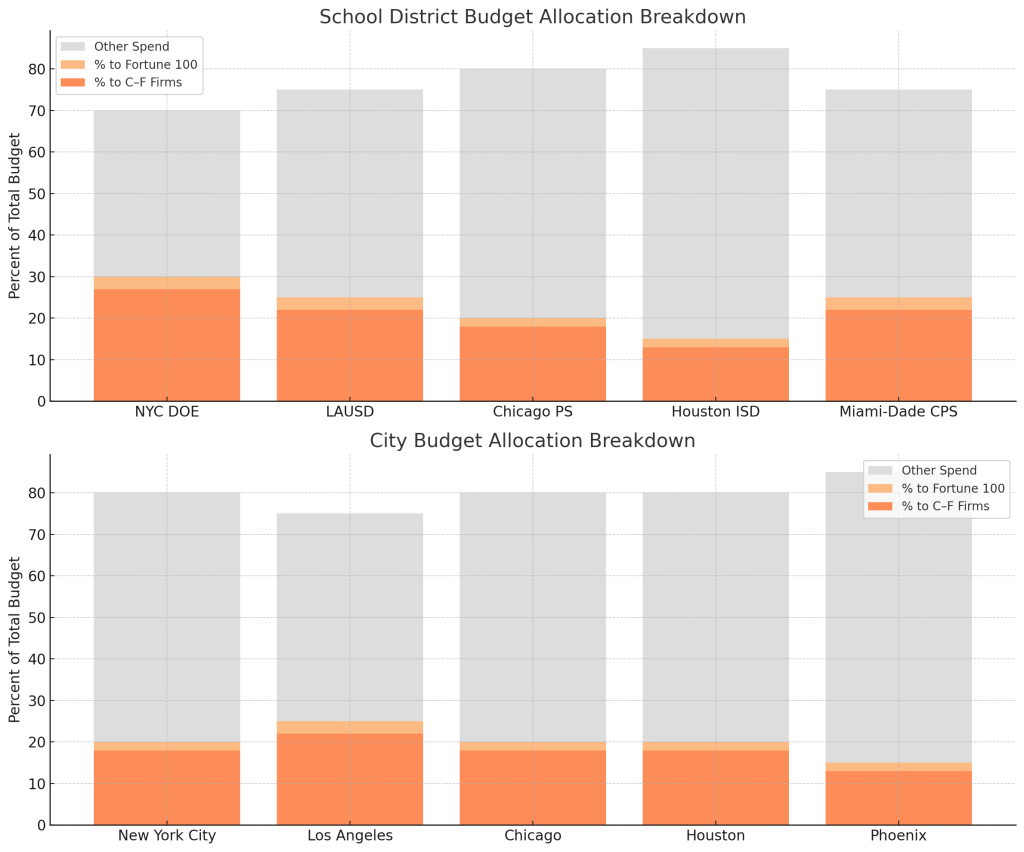
The table below illustrates these estimates. Each row shows a district’s total budget, the modeled share to Fortune 100 vendors, and the share of the budget that ends up at CEI “low‑scoring” (C–F) companies. As the CEI makes clear, nearly all those corporate vendors lack robust equity practices, meaning a large chunk of the public spending is effectively reinforcing systemic inequities.
| District (FY) | Budget Est. | % to Fortune‑100 Vendors | Est. % to C–F Firms |
| NYC DOE (2024–25) | $41.2B | ~30% | ~27% |
| Los Angeles USD (2024–25) | $18.4B | ~25% | ~22% |
| Chicago Public SD (2024) | $9.4B | ~20% | ~18% |
| Houston ISD (2025–26) | ~$2.1B | ~15% | ~13% |
| Miami-Dade CPS (2024–25) | $7.4B | ~25% | ~22% |
Notes: Budget figures from district reports; spending shares are conservative estimates. “% to C–F Firms” assumes ~90% of Fortune-100 suppliers are low‑scoring on the CEI.
Even with these modest estimates, the absolute figures are staggering. For NYC DOE, 30% of $41B is $12.4B to Fortune‑100 companies; at 90%, about $11B of the budget goes to companies that scored only C, D, or F on equity. For LAUSD, that’s roughly $4–5B in low‑graded spending. In Chicago and Miami, several billion each flows to C–F corporations annually. By contrast, only tiny slivers (2–5%) go to the two A‑rated firms (Microsoft and Best Buy) identified by the CEI. In short, public education dollars are largely coursing through the same unjust systems the CEI exposes in the private sector.
City Budgets: Public Spending Flows
We apply the same approach to five major U.S. city budgets:
- New York City, NY – Total budget ~$101B (FY2023)
- Los Angeles, CA – Budget $13.9B (FY2025–26)
- Chicago, IL – Budget ~$12.3B (FY2024)
- Houston, TX – General Fund $3.3B (FY2024)
- Phoenix, AZ – General Fund ~$2.1B (FY2024–25)
These city budgets similarly allocate funds to goods and services from major corporations. Examples include transportation infrastructure contracts (often with Fortune‑100 engineering/equipment firms), IT services (Oracle, Cisco, IBM), public utilities (energy, water, telecom), and social services (healthcare insurers, food suppliers). For modeling, we again estimate Fortune‑100 vendor shares. Large cities have heavy personnel costs, so direct procurement is a smaller slice of the total than in school districts – but still substantial. We estimate roughly 15–25% of city budgets flow to Fortune‑100 providers. Applying the CEI breakdown, almost all of that spending (∼90%) goes to poorly graded firms.
| City (FY) | Budget Est. | % to Fortune‑100 Vendors | Est. % to C–F Firms |
| New York City (2023) | $101B | ~20% | ~18% |
| Los Angeles (2025–26) | $13.9B | ~25% | ~22% |
| Chicago (2024) | $12.3B | ~20% | ~18% |
| Houston (2024) | $3.3B | ~20% | ~18% |
| Phoenix (2024–25) | $2.1B | ~15% | ~13% |
Notes: Budget figures from city financial reports; Fortune‑100 shares are model estimates. Again, the vast majority of the Fortune‑100 share are to firms graded C–F on the CEI.
For New York City, 20% of $101B is $20B to Fortune‑100; at 90%, roughly $18B goes to low‑scoring companies. In Los Angeles, ~$3–4B (out of $13.9B) is similarly exposed. In Chicago and Houston, on the order of $2–3B and $0.6B respectively flow through C–F firms each year. These funds touch everything from city sanitation equipment (perhaps built by Caterpillar or John Deere, both low‑C performers) to police technology, to city-run healthcare contracts. At scale, American cities routinely pump tens of billions into the hands of corporations with spotty equity records.
Hidden Costs: Funding Harm Through Procurement
These models underline a troubling truth: public dollars often fund harm. When school districts or cities sign checks to big corporations, they may unknowingly bankroll practices that undermine justice. For example:
- Environmental harm: Municipal contracts for construction, vehicle fuel, or building energy indirectly enrich fossil‑fuel giants. The CEI gives ExxonMobil and Chevron failing marks for climate racism. Each gallon of diesel or contract to an oil supplier potentially reinforces those harms.
- Labor abuse: Districts buy uniforms, cafeteria foods, or electronics from suppliers like Tyson Foods or Apple. Both are on the CEI’s watch list (Tyson F for child labor and safety abuses; Apple C for aggressive anti-union policies ). Public dollars spent on these goods support supply chains where exploitation is common.
- Surveillance and policing: Cities invest in tech platforms (street cameras, license-plate readers, police databases) often provided by Fortune‑100 tech/security firms. Some of these firms have ties to military and ICE contracts. For instance, if a police department buys cloud services from Amazon (AWS) or hardware from Microsoft, it flows money to the same companies profiting from prison systems and border enforcement. These sectors overlap with what we term the “military-industrial-surveillance” complex.
- Racialized finance: City pension funds and banking contracts often involve banks like JPMorgan Chase or Bank of America – both C-rated in our index due to predatory lending legacies. Public funds held or invested in such institutions inadvertently perpetuate the economic exclusion of Black and marginalized communities.
In short, without an equity lens, routine procurement becomes an institutional subsidy for racial capitalism: sweatshop manufacturing, extractive industries, immigrant detention companies, and the like. A school’s contract for new laptops might seem innocuous, but if those laptops come from an F-graded company, the purchase reinforces a disempowering system. As we noted in the CEI report, “most corporate equity language is non-binding, unmeasured, and untethered from those most impacted by inequity” – and when public agencies pay those corporations, the lack of accountability has material consequences.
Towards Institutional Equity Accountability
The implications for equity-based budgeting are profound. Cities and districts must stop treating procurement as a routine back‑office function; it is an equity issue. Just as we audit contracts for compliance and cost-efficiency, we must audit them for consumer equity. Every contract should be reviewed: does the vendor meet basic justice standards? For example, should a district continue buying from a tech firm that scores F on labor and climate, when an equitable alternative (perhaps a smaller B‑scoring firm) exists?
We should adopt what might be called an “Institutional Consumer Equity Assessment” in procurement policy. In practice, this could mean:
- Equity procurement standards: Require vendors to meet a minimum CEI threshold (e.g. no F’s) as a condition of contracting. We recommend developing a CEI-based certification for companies – akin to LEED for buildings or Fair Trade for food. Municipalities could “certify” or favor only those firms that demonstrate structural equity, and “blocklist” the worst offenders.
- Equity budget transparency: Public budgets should report not just how much is spent, but where it goes. We envision a scorecard where major contracts in a city or district are flagged with vendor CEI grades. This would make public spending more transparent and traceable to justice outcomes.
- Community oversight: Involve community groups in procurement decisions. If a school board plans a $10M facilities upgrade, affected communities should have a say in vetting the contractors’ equity records. This aligns with our Co-Design framework of shifting “who holds power, how decisions get made, and which lives are centered.”
Implementing these measures reframes institutional equity as more than performative statements. It makes equity materially accountable. If the goal of equity policy is to redistribute power and resources, then we must literally redirect the flow of dollars. Instead of defaulting to the largest corporations, dollars should be channeled to vendors demonstrably aligned with racial, economic, and environmental justice.
Sample Equity Scorecard
Below is a simplified scorecard illustrating how an illustrative district or city budget might be annotated with CEI grades. In practice, agencies could tag each major vendor with its CEI grade to highlight equity impacts. (This example is illustrative; actual vendors and percentages will vary by context.)
| Spending Category | Examples of Fortune 100 Vendors | CEI Grade | Budget $ | Notes |
| School IT & Software | Apple (C), Microsoft (A), Google/Alphabet (C) | A/C | $50M | 90% of $50M to C/A-rated vendors |
| Facility Services | Peri & Sons (not F100), ABM Industries (C) | C | $10M | Predominantly C-rated outsourcing |
| Transportation Fleet | Ford (C), GM (C), others | C | $15M | C-rated auto suppliers |
| Food Services | Sysco (C), Aramark (D), Tyson (F) | C/D/F | $8M | Mix of C–F companies (most low-scoring) |
| Utilities/Energy | Con Ed (C), PG&E (C) | C | $20M | C-rated utilities (infrastructure harm) |
| Financial Services | JP Morgan (C), BofA (C) | C | $2M | C-rated banks (predatory history) |
| Security/Police Tech | Motorola Solutions (B), AT&T (C) | B/C | $5M | Mostly B/C, but still not an A |
Illustrative equity labeling of procurement. For each category, major vendors and their CEI grades are shown. Most spending (shaded) flows to C–F firms, indicating equity risk.
Introducing the Institutional Consumer Equity Assessment
To support cities, school districts, and other public institutions in evaluating the equity impact of their spending, LRFB Equity Consulting has developed the Institutional Consumer Equity Assessment. This step-by-step tool helps institutions calculate what percentage of their expenditures flow through Fortune 100 companies—many of which have poor equity track records—and assigns a score from A to F. The assessment empowers leaders to make more intentional, equity-centered procurement decisions and redirect public dollars toward more just and community-rooted alternatives. Explore the tool and start your own assessment here.
Conclusion
Public institutions can no longer ignore the structural equity of their spending. The Consumer Equity Index has revealed that the Fortune 100 – which channel roughly 70% of consumer spending – are overwhelmingly misaligned with justice. Our analysis shows that institutional spending is similarly captured by these companies, meaning public budgets often perpetuate the same injustices CEI exposes.
The antidote is an Institutional Consumer Equity Audit: integrate CEI-style assessments into procurement, budgeting, and policy. As we wrote, “Let’s stop spending on extraction. Let’s start investing in liberation.” By adopting equity thresholds, transparent scorecards, and community oversight in contracting, schools and cities can ensure their resources advance real justice – not just rhetoric. It’s time to transform institutional equity from performative to accountable. Public dollars should become a lever for liberation, not a pump for oppression.
Bibliography
- U.S. Securities and Exchange Commission (SEC). Public 10-K and Proxy Filings. https://www.sec.gov/edgar
- Equal Employment Opportunity Commission (EEOC). “Diversity and Inclusion Workforce Data.” https://www.eeoc.gov
- Environmental Protection Agency (EPA). “Enforcement and Compliance History Online (ECHO).” https://echo.epa.gov/
- Greenpeace. Corporate Plastic Polluters Rankings, 2023. https://www.greenpeace.org/
- Human Rights Campaign. Corporate Equality Index, 2022–2024. https://www.hrc.org/
- U.S. Department of Labor. “Wage and Hour Compliance Actions.” https://www.dol.gov/agencies/whd/data
- OpenSecrets.org. “Corporate Political Contributions Database.” Center for Responsive Politics. https://www.opensecrets.org
- Global Reporting Initiative (GRI). “Sustainability Reporting Standards.” https://www.globalreporting.org
- CDP (Carbon Disclosure Project). Climate Disclosure Reports, 2020–2024. https://www.cdp.net
- Amnesty International. Corporate Human Rights Benchmark, 2023.
- Business & Human Rights Resource Centre. Company Response Tracker. https://www.business-humanrights.org
- National Employment Law Project. Labor Violations in Low-Wage Industries, 2021–2024.
- The New York Times, Business Section, 2020–2025.
- The Guardian. Investigative Series on Climate and Capitalism, 2022–2024.
- ProPublica. Workplace Inequity and Environmental Justice Investigations, 2021–2025.
- Food & Water Watch. Corporate Accountability Reports, 2023–2024.
- Institute for Policy Studies. Executive Pay and Inequality Reports, 2022–2024.
- UC Berkeley Labor Center. Low-Wage Work in Corporate America, 2021–2024.
- Just Capital. Corporate Rankings on Worker and Community Investment, 2023–2024.
- American Civil Liberties Union (ACLU). Corporate Speech and Censorship Reports, 2022–2024.
- Harvard Business Review. “Corporate ESG and Equity Performance,” selected articles, 2021–2024.
Legal Disclaimer:
The Consumer Equity Index is a research-based assessment produced by LRFB Equity Consulting, LLC. All evaluations, scores, and letter grades reflect the application of a proprietary framework grounded in publicly available data and our firm’s equity indicators. This report includes both factual summaries and opinion-based analysis. The conclusions drawn represent the professional judgments of the authors based on disclosed methodology and criteria.
Nothing in this publication should be interpreted as a statement of fact regarding any company’s intent, legality of conduct, or internal operations. LRFB Equity Consulting, LLC makes no warranties regarding the completeness or accuracy of third-party data sources. Companies are encouraged to provide clarifying information, which may be reflected in future iterations.

Leave a comment